The sparkling blue of the Adriatic has gone but the brown skin and memory remains. This year we focused on Istria: Pula, Mali Lošinj and Osor. Sailing this region of Croatia and the island hopping with a Hanse 385 Cruiser was a perfect summer adventure.
But the vacation is over and now I am heading from Budapest back to Zürich on the ÖBB Railjet 162: plenty of time to prepare this post!
The Question
I cloned https://github.com/SonarSource/sonar-examples.git then opened a command prompt under SonarSource/sonar-examples/tree/master/projects/languages/csharp and ran the following commands (based on Unit Test Execution Results Import (C#, VB.NET)):
MSBuild.SonarQube.Runner.exe begin /k:"org.sonarqube:csharp-simple-sq-scanner-msbuild" /n:"C# :: Simple Project :: SonarQube Scanner for MSBuild" /v:"1.0" /d:sonar.cs.xunit.reportsPaths="%CD%\XUnitResults.xml"
MSBuild.exe /t:Rebuild
packages\xunit.runner.console.2.1.0\tools\xunit.console.exe XUnitProject1\bin\Debug\XUnitProject1.dll -xml %CD%\XUnitResults.xml
MSBuild.SonarQube.Runner.exe end
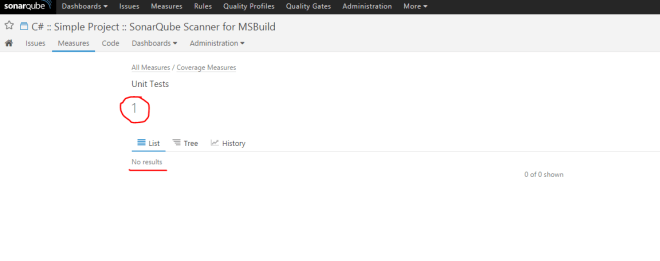
Under metric/tests/list I get “Unit Tests 1” and that is OK but beneath it the list is empty:

I simply did not understand why I was not able to drill down the test results of this C# project. I found nothing suspicious in the logs:
INFO: Sensor org.sonar.plugins.csharp.CSharpUnitTestResultsProvider$CSharpUnitTestResultsImportSensor
INFO: Parsing the XUnit Test Results file C:\workspace\SonarSource-sonar-examples-92828b2\projects\languages\csharp\XUnitResults.xml
INFO: Sensor org.sonar.plugins.csharp.CSharpUnitTestResultsProvider$CSharpUnitTestResultsImportSensor (done) | time=15ms
It bothered me so much I asked around on the official SonarQube mailing list too. I got one response… at least I was not alone with the issue. It is more than nothing. I gave Stack Overflow a chance too but no luck so I started to do the dirty job.
The Investigation
Comparing the JSON responses
I re-used two very simple projects with the help of SonarSource/sonar-examples: a Java and a C# one. I pushed the results of both to a local SonarQube instance and then compared the JSON responses.
C#:
{
   "paging":{
      "pageIndex":1,
      "pageSize":100,
      "total":0
   },
   "baseComponent":{
      "id":"AVV6fdxDjdEPPoHbjrEx",
      "key":"org.sonarqube:csharp-simple-sq-scanner-msbuild",
      "name":"C#MSBuild",
      "qualifier":"TRK",
      "measures":[
         {
            "metric":"tests",
            "value":"1",
            "periods":[
               {
                  "index":1,
                  "value":"0"
               },
               {
                  "index":2,
                  "value":"1"
               },
               {
                  "index":3,
                  "value":"0"
               }
            ]
         }
      ]
   },
   "components":[

   ]
}
Java:
{
   "paging":{
      "pageIndex":1,
      "pageSize":100,
      "total":1
   },
   "baseComponent":{
      "id":"AVZADqxkeSE9GOvlogza",
      "key":"org.sonarqube:example-ut-maven-jacoco",
      "name":"JavaUT",
      "qualifier":"TRK",
      "measures":[
         {
            "metric":"tests",
            "value":"2",
            "periods":[
               {
                  "index":1,
                  "value":"2"
               },
               {
                  "index":2,
                  "value":"2"
               },
               {
                  "index":3,
                  "value":"2"
               }
            ]
         }
      ]
   },
   "components":[
      {
         "id":"AVZADq5p6Qz7lWVR41QW",
         "key":"org.sonarqube:example-ut-maven-jacoco:src/test/java/example",
         "name":"src/test/java/example",
         "qualifier":"DIR",
         "path":"src/test/java/example",
         "measures":[
            {
               "metric":"tests",
               "value":"2",
               "periods":[
                  {
                     "index":1,
                     "value":"2"
                  },
                  {
                     "index":2,
                     "value":"2"
                  },
                  {
                     "index":3,
                     "value":"2"
                  }
               ]
            }
         ]
      }
   ]
}
Wrong way. The data is just not there thus it can not be a UI bug.
Debugging the backend
I cloned the Git project of SonarQube and opened it with IntelliJ IDEA.
Starting the Sonar instance in debug was easy:
%SONAR%/conf/wrapper.conf:
wrapper.java.additional.1=-Djava.awt.headless=true -Xdebug -Xrunjdwp:transport=dt_socket,server=y,suspend=n,address=1044
%SONAR%/conf/sonar.properties:
sonar.web.javaAdditionalOpts=-Xdebug -Xrunjdwp:transport=dt_socket,server=y,suspend=n,address=1045
After debugging the pits of hell I got the feeling that the backend is somehow OK but the required data is just not there.
Analyzing the C# plugin
What about SonarQube’s C# plugin? I read the docs and found something:
Drilldown on Test Execution Results is not supported
Tests execution results will be displayed on project level dashboards.
Gotcha! From this point the events sped up:
- https://jira.sonarsource.com/browse/SONARNTEST-17
- https://jira.sonarsource.com/browse/SONARMSBRU-233
- http://stackoverflow.com/questions/29117785/no-drilldown-from-sonarqube-unit-test-success-widget
- http://stackoverflow.com/questions/32398175/drill-down-results-of-success-failure-test-cases-on-sonar-dashboard
It is not a bug or configuration issue. I posted my findings to the Stack Overflow and to the mailing list too.
Next?
I keep my eyes open and watching these open tickets and mailing lists.
Update
- SONARCS-657 – Import test cases and attach them to their corresponding test source files (allow to drill down) – Closed and Won’t fix
