
From an earlier chapter of the blog. Kept for the record.
The sparkling blue of the Adriatic has gone but the brown skin and memory remains. This year we focused on Istria: Pula, Mali Lošinj and Osor. Sailing this region of Croatia and the island hopping with a Hanse 385 Cruiser was a perfect summer adventure.
But the vacation is over and now I am heading from Budapest back to Zürich on the ÖBB Railjet 162: plenty of time to prepare this post!
The Question
I cloned https://github.com/SonarSource/sonar-examples.git then opened a command prompt under SonarSource/sonar-examples/tree/master/projects/languages/csharp and ran the following commands (based on Unit Test Execution Results Import (C#, VB.NET)):
MSBuild.SonarQube.Runner.exe begin /k:"org.sonarqube:csharp-simple-sq-scanner-msbuild" /n:"C# :: Simple Project :: SonarQube Scanner for MSBuild" /v:"1.0" /d:sonar.cs.xunit.reportsPaths="%CD%\XUnitResults.xml"
MSBuild.exe /t:Rebuild
packages\xunit.runner.console.2.1.0\tools\xunit.console.exe XUnitProject1\bin\Debug\XUnitProject1.dll -xml %CD%\XUnitResults.xml
MSBuild.SonarQube.Runner.exe end
Under metric/tests/list I get “Unit Tests 1” and that is OK but beneath it the list is empty:
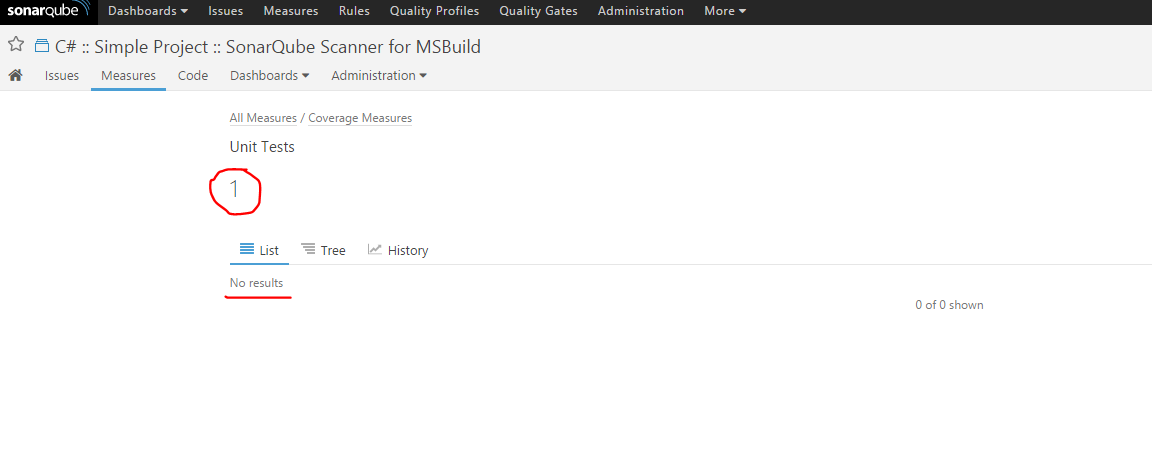
I simply did not understand why I was not able to drill down the test results of this C# project. I found nothing suspicious in the logs:
INFO: Sensor org.sonar.plugins.csharp.CSharpUnitTestResultsProvider$CSharpUnitTestResultsImportSensor
INFO: Parsing the XUnit Test Results file C:\workspace\SonarSource-sonar-examples-92828b2\projects\languages\csharp\XUnitResults.xml
INFO: Sensor org.sonar.plugins.csharp.CSharpUnitTestResultsProvider$CSharpUnitTestResultsImportSensor (done) | time=15ms
It bothered me so much I asked around on the official SonarQube mailing list too. I got one response… at least I was not alone with the issue. It is more than nothing. I gave Stack Overflow a chance too but no luck so I started to do the dirty job.
The Investigation
Comparing the JSON responses
I re-used two very simple projects with the help of SonarSource/sonar-examples: a Java and a C# one. I pushed the results of both to a local SonarQube instance and then compared the JSON responses.
C#:
{
   "paging":{
      "pageIndex":1,
      "pageSize":100,
      "total":0
   },
   "baseComponent":{
      "id":"AVV6fdxDjdEPPoHbjrEx",
      "key":"org.sonarqube:csharp-simple-sq-scanner-msbuild",
      "name":"C#MSBuild",
      "qualifier":"TRK",
      "measures":[
         {
            "metric":"tests",
            "value":"1",
            "periods":[
               {
                  "index":1,
                  "value":"0"
               },
               {
                  "index":2,
                  "value":"1"
               },
               {
                  "index":3,
                  "value":"0"
               }
            ]
         }
      ]
   },
   "components":[

   ]
}
Java:
{
   "paging":{
      "pageIndex":1,
      "pageSize":100,
      "total":1
   },
   "baseComponent":{
      "id":"AVZADqxkeSE9GOvlogza",
      "key":"org.sonarqube:example-ut-maven-jacoco",
      "name":"JavaUT",
      "qualifier":"TRK",
      "measures":[
         {
            "metric":"tests",
            "value":"2",
            "periods":[
               {
                  "index":1,
                  "value":"2"
               },
               {
                  "index":2,
                  "value":"2"
               },
               {
                  "index":3,
                  "value":"2"
               }
            ]
         }
      ]
   },
   "components":[
      {
         "id":"AVZADq5p6Qz7lWVR41QW",
         "key":"org.sonarqube:example-ut-maven-jacoco:src/test/java/example",
         "name":"src/test/java/example",
         "qualifier":"DIR",
         "path":"src/test/java/example",
         "measures":[
            {
               "metric":"tests",
               "value":"2",
               "periods":[
                  {
                     "index":1,
                     "value":"2"
                  },
                  {
                     "index":2,
                     "value":"2"
                  },
                  {
                     "index":3,
                     "value":"2"
                  }
               ]
            }
         ]
      }
   ]
}
Wrong way. The data is just not there thus it can not be a UI bug.
Debugging the backend
I cloned the Git project of SonarQube and opened it with IntelliJ IDEA.
Starting the Sonar instance in debug was easy:
%SONAR%/conf/wrapper.conf:
wrapper.java.additional.1=-Djava.awt.headless=true -Xdebug -Xrunjdwp:transport=dt_socket,server=y,suspend=n,address=1044
%SONAR%/conf/sonar.properties:
sonar.web.javaAdditionalOpts=-Xdebug -Xrunjdwp:transport=dt_socket,server=y,suspend=n,address=1045
After debugging the pits of hell I got the feeling that the backend is somehow OK but the required data is just not there.
Analyzing the C# plugin
What about SonarQube’s C# plugin? I read the docs and found something:
Drilldown on Test Execution Results is not supported
Tests execution results will be displayed on project level dashboards.
Gotcha! From this point the events sped up:
- https://jira.sonarsource.com/browse/SONARNTEST-17
- https://jira.sonarsource.com/browse/SONARMSBRU-233
- http://stackoverflow.com/questions/29117785/no-drilldown-from-sonarqube-unit-test-success-widget
- http://stackoverflow.com/questions/32398175/drill-down-results-of-success-failure-test-cases-on-sonar-dashboard
It is not a bug or configuration issue. I posted my findings to the Stack Overflow and to the mailing list too.
Next?
I keep my eyes open and watching these open tickets and mailing lists.
Update
- SONARCS-657 – Import test cases and attach them to their corresponding test source files (allow to drill down) – Closed and Won’t fix

You helped me a lot at this time, thanks for this post!
LikeLike